Solar battery worth it Sunshine Coast depends on your electricity use, solar exports, evening demand, tariff, battery size and backup priorities. A battery can improve self-consumption and resilience, but savings vary widely. The best decision comes from interval data, realistic degradation assumptions, current Queensland tariffs and a properly designed system rather than a headline payback claim.
This article walks through a simple payback method, then three worked examples with realistic numbers. You will see where batteries look strong, where they struggle, and how things like electric vehicles and blackout protection change the picture. Sunshine Coast Projects & Electrical also uses similar logic when helping locals weigh up real quotes.
If you want to know whether a solar battery could be worth it on the Sunshine Coast for your home, the rest of this guide shows you how to run the numbers with clear, practical steps.
Key Takeaways
-
Many 2026 style tariff plans can make a solar battery worthwhile on the Sunshine Coast for homes with solid night usage. The price gap between peak grid power and low feed-in tariffs means stored solar can often return more value replacing your own evening usage than it earns as export. The benefits depend heavily on battery utilisation, correct sizing and product performance.
-
The main drivers of battery value are:
-
the usage tariff you avoid
-
the feed-in tariff you give up
-
how much extra self-consumption you gain.
The more of your solar you can store and use at night instead of buying power, the more each stored kilowatt hour works for you. If you already self-use most of your solar during the day, the room for extra gains is smaller.
-
-
Across real Sunshine Coast style case data, simple payback for home batteries often falls in a broad 5 to 9 year range. Some properties see faster outcomes when strong rebates, high time-of-use tariffs and large evening loads line up, while other properties stretch toward or beyond expected battery life. These timeframes are guides only, not promises or guarantees.
-
Payback tends to look stronger for:
-
families on time-of-use tariffs with big night loads
-
homes with larger solar arrays
-
households and businesses with electric vehicles.
It looks weaker for low-use couples on flat tariffs with small systems and little evening demand. Your result sits where your own usage, solar size and tariff mix place you.
-
-
A local Clean Energy Council accredited installer can pull interval data, check your actual tariff and model realistic battery behaviour under 2026 Queensland conditions. Sunshine Coast Projects & Electrical does this with clear written assumptions, so you can see whether a battery suits your home today or is better left as a stage two upgrade later.
What Do 2026 Queensland Tariffs Mean For Solar Battery Payback?
What 2026 Queensland tariffs mean for solar battery payback on the Sunshine Coast is mostly about the widening price gap between buying and exporting power. In simple terms, you now usually pay far more for each kilowatt hour from the grid than you earn for sending solar out.
When peak usage charges sit well above 30 cents per kilowatt hour and some sit beyond 40 cents, while many feed-in tariffs sit in the single digits, storing energy often looks more attractive. A battery lets you swap low value export for higher value self-use during the afternoon and evening peaks.
Tariffs and government rules do change, so for any decision you should:
-
check your latest bills and product disclosure statements from your retailer
-
compare current offers using official tools such as the Australian Government’s Energy Made Easy website (https://www.energymadeeasy.gov.au)
-
review current Queensland information through resources such as the Queensland Government’s energy pages (https://www.qld.gov.au/environment/coasts-waterways/energy).
Sunshine Coast Tariffs, Feed-In Rates And Networks In Plain Language
On the Sunshine Coast you sit in the Energex distribution area, which covers South East Queensland. Energex owns the poles and wires, while private retailers such as Origin, AGL and EnergyAustralia set their own usage tariffs and feed-in rates. In regional Queensland, Ergon often supplies both network and retail services under regulated prices set by the Queensland Competition Authority.
Key ideas:
-
Your usage tariff is what you pay for each kilowatt hour you draw from the grid. Many plans now use time-of-use pricing with different rates for peak, shoulder and off-peak periods.
-
Peak often covers roughly late afternoon to late evening, shoulder covers mid-day and early evening, while off-peak covers overnight and some weekend hours. Specific times vary by plan and retailer.
-
Your feed-in tariff is what your retailer pays for each kilowatt hour of solar you export. On many current style offers, feed-in tariffs sit roughly around 5 to 8 cents per kilowatt hour, while peak usage can be more than five times that level. Even simple flat tariffs often sit well above the feed-in value.
This is the value flip that many solar owners are now seeing. Stored solar that you later use replaces a 30 to 40 plus cent grid purchase instead of earning only a few cents as export. Again, tariffs and feed-in rates change often, so you must always check your own bill and compare current offers through government comparison tools and retailers.
The Battery “Value Gap”: Self-Consumption Vs Exporting
The battery value gap is the difference between what one kilowatt hour earns as export and what it saves when used later.
-
If you export one kilowatt hour at 7 cents, that is all you receive.
-
If you store that same kilowatt hour, then use it at a time when grid power costs 35 to 45 cents, the gross value of that energy jumps into the mid tens of cents.
This gross gap of around 25 to 40 cents per kilowatt hour is the pool of value that slowly repays the battery over many years. It is not the actual saving, because real systems:
-
lose some energy in charging and discharging
-
do not fully charge or empty perfectly every day
-
experience weather variation and seasonal shifts.
Over time batteries also degrade, so a 10 kilowatt hour unit might deliver less usable energy each day after a decade. Some days your solar may not fully charge the battery, especially in cloudy winters. These factors mean careful design and sizing matter much more than chasing the largest storage unit you can afford.
How Do You Actually Calculate Solar Battery Payback On The Sunshine Coast?
Calculating solar battery payback on the Sunshine Coast is mainly about turning extra self-consumption into annual dollar savings, then comparing that with the installed cost. You estimate the kilowatt hours your battery will deliver each year and multiply that by the tariff gap between usage and export.
This type of quick calculation will never match full software modelling, which is why formal techno-economic optimization of PV-battery systems models these variables across multi-year periods, yet it still gives a practical way to judge whether a solar battery is likely to make sense for your home. It also shows which input figures move the result the most, so you can focus on those when speaking with your installer or retailer.
Simple Method: From Extra Self-Consumption To Payback Years
A simple, back-of-the-envelope method looks like this:
-
Work out your solar surplus.
-
Use past power bills and your inverter or monitoring app to see how many kilowatt hours you export on a typical day.
-
That exported energy is the “fuel” your future battery would use, because your current loads already consume the rest in real time.
-
-
Pick a realistic battery size in usable kilowatt hours.
-
Many lithium units reserve a slice of capacity to protect cell health, so a 10 kilowatt hour model might offer only about 9 kilowatt hours of usable storage.
-
Check the product sheet or ask your installer for usable capacity, not just the nominal figure.
-
-
Estimate how full the battery will be on an average day.
-
Batteries rarely run from 0 to 100 percent every single day.
-
On the Sunshine Coast you might fill it most sunny days in summer and less often in winter.
-
A rough starting point for many homes might be 70 to 80 percent of usable capacity, averaged over the year.
-
-
Allow for round-trip efficiency.
-
Modern lithium home batteries often sit in the 85 to 95 percent range.
-
If you store 9 kilowatt hours each day and your efficiency is 90 percent, you will only receive about 8.1 kilowatt hours back into your loads.
-
-
Scale up to annual delivered energy.
-
Multiply your daily delivered kilowatt hours by 365 to get an annual figure.
-
-
Multiply by the tariff gap.
-
Subtract your feed-in tariff from the usage tariff you are offsetting (or a weighted average of peak and shoulder if that is more accurate).
-
Multiply annual delivered kilowatt hours by this tariff gap to find a rough annual financial benefit.
-
-
Divide battery cost by annual benefit.
-
Use your fully installed battery cost after any rebates.
-
Divide by annual benefit to get a simple payback in years.
-
This is only a guide. It does not include:
-
financing costs or interest
-
tariff or rule changes
-
maintenance or inverter replacement risk
-
any value from blackout protection.
It does, however, give a clear starting point for deciding whether to move ahead with design and quotes.
Key Assumptions That Change Your Payback Result
Several key assumptions can swing your payback result by many years.
-
Battery cost and support
-
Both pre and post-rebate costs matter.
-
The Small-scale Renewable Energy Scheme (SRES) usually helps reduce the solar panel side of the bill through Small-scale Technology Certificates (see the Clean Energy Regulator: https://www.cleanenergyregulator.gov.au).
-
Programs such as the Cheaper Home Batteries Program or Queensland Battery Booster Program, when active, can reduce part of the storage price. These schemes change over time, so you must confirm details through current Queensland and Australian Government sources.
-
-
Battery life and degradation
-
Many quality brands such as Tesla, Sungrow, BYD, Fronius and iStore offer performance warranties around 10 years, often promising a certain remaining capacity after a set number of cycles.
-
A longer lived battery that holds capacity well will deliver more kilowatt hours and more potential savings for each dollar of cost. Check actual warranty documents rather than assuming performance.
-
-
Your usage pattern
-
High evening and night usage on a time-of-use tariff tends to produce more value per stored kilowatt hour than low evening usage on a gentle flat tariff.
-
The same 10 kilowatt hour battery in two different homes can see very different outcomes.
-
-
System design
-
A battery that is sized sensibly against your solar array, inverter and any export caps gives better utilisation.
-
In practice that can matter more than squeezing every last panel on the roof.
-
Sunshine Coast Projects & Electrical uses property-specific bill data, interval data where available and tariff details to refine these assumptions before suggesting any storage size.
Worked Example 1: Is A Small Solar Battery Worth It For A Typical Sunshine Coast Family?
Worked example 1 looks at whether a small solar battery is worth considering for a typical Sunshine Coast family on a time-of-use plan. This kind of home often has a standard 6.6 kilowatt solar system, parents at work during the day and a big jump in usage when everyone gets home.
The example does not promise that your house will see the same figures. Instead, it shows the shape of the maths so you can see how a solar battery might perform when your usage profile fits a similar pattern.
Base Case: 6.6 kW Solar, 10 kWh Battery On Time-Of-Use Tariff
Here is a set of rounded assumptions that suit many four-person homes across the region. The Sunshine Coast sits in solar Zone 3 under Clean Energy Regulator guidance, which means a 6.6 kilowatt system might produce roughly 9,500 to 10,000 kilowatt hours per year in real conditions.
Key assumptions:
-
Solar size: 6.6 kW already installed
-
Annual solar output: about 9,500 kWh
-
Daytime self-use: 3,500 kWh per year
-
Annual export without battery: 6,000 kWh
-
Battery size: 10 kWh nominal, 9 kWh usable
-
Round-trip efficiency: 90 percent
-
Peak usage tariff: about 38 to 42 c/kWh
-
Shoulder usage tariff: mid 20s c/kWh
-
Feed-in tariff: about 6 to 8 c/kWh
With family members out most of the day, the household exports a large share of solar. We assume the battery can usually charge close to full on sunny days, but across the year it averages about 8 kilowatt hours drawn from stored energy each evening. With 90 percent efficiency, that gives 7.2 kilowatt hours of delivered energy most days.
Over a full year that is roughly:
-
7.2 kWh/day × 365 ≈ 2,628 kWh delivered from the battery.
If we assume:
-
a weighted average usage rate of about 32 c/kWh (mix of peak and shoulder)
-
a feed-in rate of about 7 c/kWh
then the tariff gap is about 25 c/kWh.
Annual benefit (approximate):
-
2,628 kWh × $0.25 ≈ $657 per year.
Now assume an installed cost for a quality 10 kilowatt hour battery somewhere in a notional band:
-
If net cost were $6,000, a simple payback would be around 9 years ($6,000 ÷ $657 ≈ 9.1).
-
If rebates reduced net cost, payback would shorten; if costs were higher, payback would lengthen.
These are not quotes or promises, just transparent maths using labelled assumptions. You must obtain site-specific quotes and confirm current tariffs and program rules before relying on any figure.
Sensitivity: What If Tariffs Or Usage Change Over Time?
Small changes in your inputs can stretch or shrink payback for the same hardware. Imagine three simple scenarios for the same family.
-
Scenario A: Peak tariffs rise, feed-in stays flat or falls
-
Each stored kilowatt hour offsets more expensive grid power.
-
Export value does not rise as fast, so the gap widens.
-
Annual benefit grows, and payback can shorten by a year or two.
-
-
Scenario B: Peak tariffs fall or feed-in increases
-
The gap between usage and export closes.
-
Each stored kilowatt hour now earns less relative benefit.
-
Payback period stretches, even though the system has not changed.
-
-
Scenario C: Evening usage drops
-
Perhaps teenagers move out, or appliances shift to more efficient models.
-
The battery cycles less energy each night, lowering utilisation.
-
Annual benefit falls and payback lengthens.
-
Modular, stackable designs from brands like BYD and Sungrow can help because they allow capacity changes later. A short review with your installer every few years helps check settings, tariffs and usage against your original design.
Worked Example 2: Larger Battery With EV Charging And Higher Night-Time Use
Worked example 2 asks whether a bigger battery looks more attractive when you have high night usage and an electric vehicle. Many Sunshine Coast homes now combine a large solar array, pool pump, ducted air conditioning and at least one EV, which can add 10 kilowatt hours or more to night load on busy days.
In these cases, a solar battery can be appealing when it soaks up large daytime surpluses and feeds heavy evening and EV loads. The key is avoiding a battery so large that it rarely fills or empties.
High-Use Home: 13 kW Solar, 15 kWh Battery, One EV
Consider a home with a 13 kilowatt solar array on a generous roof. In Zone 3 that might produce roughly 18,000 to 20,000 kilowatt hours per year. The house has a pool pump, ducted air, electric cooking and one EV that often charges at home.
Assumptions:
-
Solar size: 13 kW new system
-
Annual solar output: 18,500 kWh
-
Daytime self-use: 7,000 kWh per year
-
Annual export without battery: 11,500 kWh
-
Battery size: 15 kWh nominal, 13.5 kWh usable
-
Round-trip efficiency: 92 percent
-
Peak usage tariff: around 40 to 45 c/kWh
-
Feed-in tariff: about 6 to 8 c/kWh
-
EV usage: 3,000 kWh per year (much of it at night)
With high output and strong daytime surplus, this home can usually fill the battery on most sunny days. Suppose the battery charges to 13.5 kilowatt hours and then discharges around 12 kilowatt hours into evening house loads and overnight EV charging. At 92 percent efficiency across the year, that might equate to roughly 4,000 kilowatt hours of delivered energy.
If we assume:
-
average peak usage rate: about 42 c/kWh
-
feed-in rate: about 7 c/kWh
then the tariff gap is about 35 c/kWh.
Annual benefit (approximate):
-
4,000 kWh × $0.35 ≈ $1,400 per year.
Even with a higher installed cost for a 15 kilowatt hour battery, that higher utilisation can improve the payback compared to the smaller family example. For instance, if the net installed price were somewhere in a broad mid-range and consistent with that usage, payback could potentially fall in the 6 to 8 year band.
Again, this is not a quote. Tariffs, product choices, finance costs and rebates all shift the real result, and your installer must confirm current figures and site-specific factors before you rely on any estimate.
Sensitivity: Does A Bigger Battery Always Pay Back Faster?
A larger unit does not always pay back faster, even for high-use homes. What matters is how often you cycle a large share of the usable capacity.
Consider two options for the same home:
-
Option 1: 10 kWh usable battery
-
Cycles about 9 kWh most days
-
Very high utilisation of installed capacity
-
Each dollar spent on storage handles many kilowatt hours over the warranty period.
-
-
Option 2: 25 kWh usable battery
-
Still only cycles about 12 kWh most days
-
Much of the capacity sits idle
-
Cost per delivered kilowatt hour is higher.
-
In this situation the smaller or medium-sized unit can have better payback despite having less total storage.
Modular batteries from brands like BYD and Sigenergy let you begin with a medium stack, then add blocks as your EV usage or family size grows. A local energy audit from a company that designs both solar and EV charging helps match capacity to your real pattern rather than to brochure sizes. That type of work is a key reason many EV owners who proceed with storage achieve more realistic outcomes than rough estimates might suggest.
Worked Example 3: Is A Solar Battery Worth It For Low Evening Use Or Flat Tariffs?
Worked example 3 looks at a home where low night usage and a gentle flat tariff lead to weaker battery economics. This is important because it shows that a solar battery is not always a strong financial choice on the Sunshine Coast for every household, even under 2026 style tariffs.
By stepping through a modest solar system and light evening load, you can see how payback can stretch towards or beyond expected battery life. That does not automatically mean storage is a poor choice, only that the reasons for buying shift toward resilience, comfort and self-reliance rather than bill savings.
Low-Use Couple On Flat Tariff With Modest Solar
Imagine a retired couple in a small home with a 4.5 kilowatt solar system. They are home during the day, use ceiling fans more than air conditioning and cook early in the evening. Their retailer plan uses a simple flat usage rate with a modest feed-in rate.
Assumptions:
-
Solar size: 4.5 kW
-
Annual solar output: 6,500 kWh
-
Daytime self-use: 4,000 kWh per year
-
Annual export without battery: 2,500 kWh
-
Battery size: 7 kWh nominal, 6 kWh usable
-
Round-trip efficiency: 90 percent
-
Flat usage tariff: 30 c/kWh
-
Feed-in tariff: about 8 c/kWh
Because the couple already use a high share of their solar during the day, there is limited surplus to charge a battery, especially in winter. Suppose the battery only fills to about 4 kilowatt hours on an average day and discharges the same amount into evening loads. At 90 percent efficiency, that equals roughly:
-
4 kWh × 0.90 × 365 ≈ 1,314 kWh per year.
The tariff gap between a 30 cent flat usage rate and an 8 cent feed-in rate is 22 cents.
Annual benefit (approximate):
-
1,314 kWh × $0.22 ≈ $289 per year.
Even with a modest small-battery cost, that type of benefit can easily lead to a simple payback longer than 12 years. When the expected battery life is often around 10 to 15 years under warranty terms, such long payback starts to look marginal from a pure cost perspective.
In this type of case a solar battery might not stack up purely for bill savings, though the couple may still consider one for other reasons.
When A Battery Still Makes Sense For Peace Of Mind
Non-financial benefits often matter a lot for older households and rural properties. A storage system that keeps the fridge, freezer, lights and communications running through storm season can be very reassuring, even if the bill savings alone do not justify it.
For people who rely on powered medical devices, that resilience can be more important than strict return on investment. Some semi-rural Sunshine Coast homes have feeder lines that drop out during storms, and a well designed backup-capable system can cut the stress of repeated outages.
A battery also lets owners increase their self-reliance and cut emissions by using more of their own solar. The team can model the numbers honestly and then help each person weigh this peace-of-mind value against the dollar cost. The choice is very personal and depends on health, risk tolerance and budget.
How Do Tariffs, Battery Efficiency, Degradation And Warranties Shape Long-Term Value?
Tariffs, battery efficiency, degradation and warranties shape long-term value by controlling how many useful kilowatt hours your system delivers and how much each is worth. Even when two homes buy the same storage unit, different tariffs and performance curves can lead to very different life outcomes.
For anyone asking if a solar battery is worth it on the Sunshine Coast, it helps to think of the system as a machine that turns sunlight into a long stream of useful energy over 10 or more years. The efficiency and durability of that machine affect how much value you see.
Battery Efficiency, Degradation And Real-World Output
Round-trip efficiency measures what share of stored energy you get back after charging and discharging. If your battery has 90 percent round-trip efficiency, you will only get 9 kilowatt hours back for every 10 kilowatt hours put in. This loss happens as heat and electronic overhead inside the inverter and battery.
Degradation means the total capacity falls slowly with age and use, a pattern documented in operational battery ageing research estimating performance, capacity and power fade from real electricity market data, and a new 10 kilowatt hour unit might be able to charge close to that amount, but after 10 years of daily cycling it might only hold 6 or 7 kilowatt hours. Many product warranties from Tesla, BYD and similar brands promise a minimum remaining capacity, often around 60 to 70 percent after a set number of cycles. The exact figures are in the manufacturer’s warranty documents.
In the worked examples we used usable kilowatt hours rather than headline values to reflect both efficiency and reserved capacity. Real-world output is often lower than people expect from brochures that quote ideal conditions. Hot Sunshine Coast summers can also raise battery temperature, so correct placement in a shaded, ventilated area such as a garage is important under AS/NZS 5139 guidance for battery installations.
Good design around shading, airflow and spacing helps protect cells from heat stress and keeps degradation closer to the warranty curve. That in turn keeps your long-term delivered kilowatt hours higher and supports better value for each dollar invested.
Warranties, Quality Brands And “Orphan Systems”
Warranties and product support are central to battery economics. A typical home storage warranty lasts about 10 years and may include both:
-
a time limit (for example 10 years from installation), and
-
a maximum energy throughput or cycle count.
It also usually states the minimum capacity the battery should hold near the end of that period. To assess value, you should read warranty documents and, where needed, ask for plain-English explanations.
An orphan system is one where the installer or the manufacturer no longer operates in Australia, so the owner struggles to claim warranty help or spare parts. Early waves of solar left many households in this position when low-cost importers closed. With batteries, such outcomes can be even more frustrating because the hardware is more complex and integrated.
Working with Tier one brands that have strong local support, such as Tesla, Sungrow, BYD, Fronius, iStore and Sigenergy, lowers that risk. Sunshine Coast Projects & Electrical focuses on this end of the market and supports installations with QLD electrical contractor licence 79977, which gives owners better prospects for long-term help.
If a battery fails early or loses capacity far faster than expected, even the best tariff and usage pattern will not rescue the economics. Good warranties and a stable installer reduce that risk and help any payback estimate remain realistic.
Which Sunshine Coast Homes And Businesses Typically Get The Best Battery Payback?
The Sunshine Coast homes and businesses that tend to get the best battery payback are usually those with high night usage and solid daytime solar surplus. When large parts of your consumption line up with expensive tariff periods, every stored kilowatt hour has more work to do.
This is why a solar battery is often more attractive for families with big evening loads and time-of-use tariffs, while quieter homes on flat plans sometimes see weaker returns. Understanding your pattern is the starting point.
Strong Candidate Profiles Under 2026 Tariffs
Certain usage profiles point toward stronger battery value under 2026 style tariffs:
-
Large families with air conditioning, pool pumps, dishwashers and entertainment gear running most evenings.
-
Homes that are empty during work hours and then very active from late afternoon onwards.
-
Properties with solar arrays of 6.6 kilowatts or more and regular daytime surplus, which provide enough solar “fuel” to fill a battery.
-
Households on time-of-use plans with a clear price gap between peak and off-peak or between usage and feed-in rates.
-
Electric vehicle owners or those planning an EV within a few years, as night charging is a natural use for stored solar.
-
Properties on feeders that experience regular storm-related outages or semi-rural lines, where blackout protection adds value.
-
Sites eligible for current Queensland or Federal programs that reduce upfront cost or pay for participation in virtual power plants (where available and appropriate).
If several of these points describe your home or business, there is a fair chance a detailed design will show a battery that looks reasonable under 2026 conditions. A site-specific review is still needed before deciding.
When You May Be Better Off With Solar-Only (For Now)
Other situations favour a focus on solar panels alone before adding storage:
-
Very small roofs or systems already close to network export limits may not have enough surplus to keep a battery busy.
-
Households that use most power during the day and very little at night may leave storage underused.
-
People planning to move within a few years face a shorter window to recover costs, although a good solar and battery setup can help property appeal.
-
Tight budgets where investing in efficiency upgrades (insulation, hot water, efficient appliances) might deliver better returns first.
Helpful steps in the meantime include:
-
shifting loads such as hot water or pool pumping into the day using timers or smart controls
-
checking that your retailer plan still suits your usage pattern
-
choosing a battery-ready hybrid inverter if you replace or expand solar hardware, so a later stage two battery addition is simpler.
Seeing the battery as a possible later upgrade rather than a mandatory extra can protect your budget while keeping options open.
How Can Sunshine Coast Projects & Electrical Help You Decide If A Battery Is Worth It?
Sunshine Coast Projects & Electrical helps locals decide whether a battery is worth considering by linking real tariff data, usage patterns and product options into clear design choices. They combine licensed electrical work with Clean Energy Council accredited solar and storage design for homes and businesses across the region.
For anyone unsure about storage, having one team handle both the maths and the on-site work can remove a lot of guesswork. Instead of generic sales talk, you receive grounded numbers and a system layout that suits your switchboard and wiring.
Local, Transparent Payback And System Design Support
The process generally runs along these lines:
-
Collect data
-
Recent power bills show annual consumption and tariffs.
-
Where possible, interval data from your retailer or smart meter shows how usage varies through the day and across seasons.
-
-
Analyse usage and solar potential
-
Day versus night usage is mapped for summer and winter.
-
Existing or planned solar size, roof orientation and shading are considered to estimate likely surplus energy.
-
-
Build a simple financial model
-
Your exact usage tariff, feed-in tariff and any time-of-use structure are entered.
-
Assumptions for round-trip efficiency, usable capacity, annual cycles and battery degradation are documented.
-
Simple payback and broad return-on-investment estimates are prepared.
-
-
Provide clear, written assumptions
-
Quotes list proposed brands and sizes, expected usable kilowatt hours, and how current Federal schemes such as Small-scale Technology Certificates and any active Queensland programs are applied.
-
The aim is transparency so you can check every assumption.
-
They also take time to talk about non-financial aims such as blackout protection, medical needs, EV charging, renovations or business continuity. Managing Director Charlie Doblo has more than 20 years’ trade experience and leads a local team that keeps language plain and avoids pressure. They explain where the numbers look solid, where they do not, and what changes might improve them.
Installation Quality, Integration And Long-Term Support
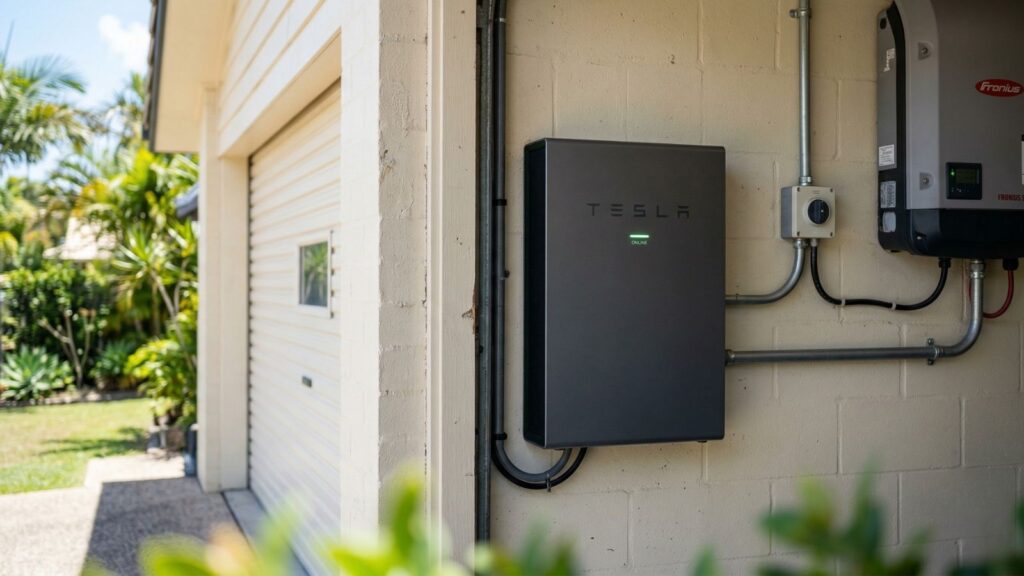
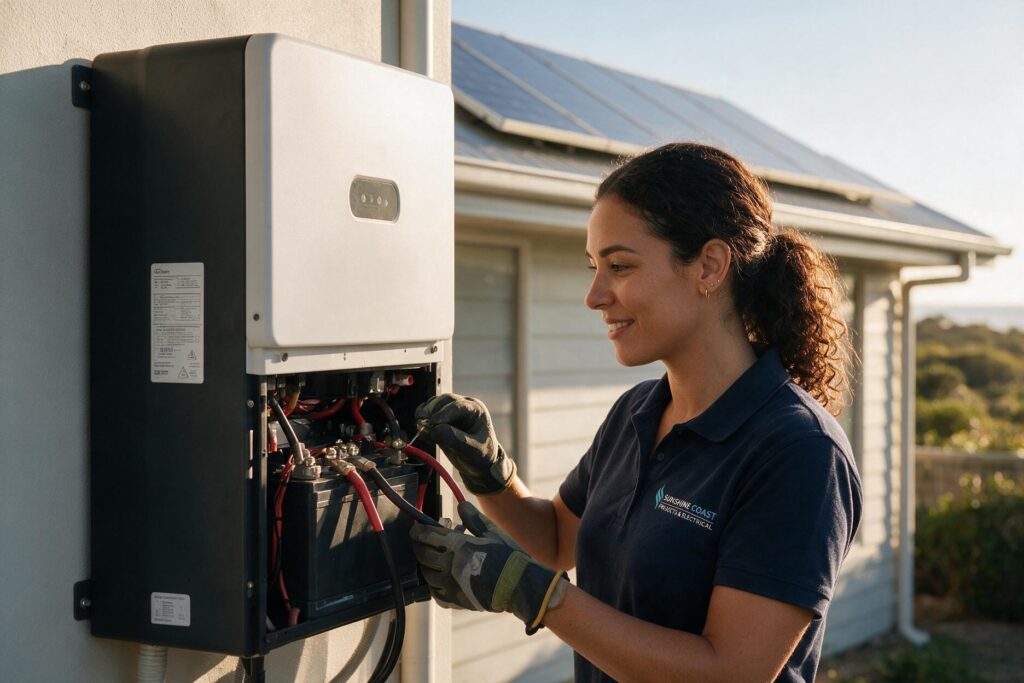
Once you decide to proceed, the same company manages design, installation and long-term support. As Accredited Master Electricians and Clean Energy Council accredited installers, they handle AC-coupled retrofits such as Tesla Powerwall as well as hybrid inverter based systems from Sungrow, Fronius, BYD, iStore and similar brands.
Practical points they focus on include:
-
integrating batteries with existing solar and switchboards
-
allowing for EV chargers now or later
-
complying with Australian Standards such as AS/NZS 3000 (Wiring Rules) and AS/NZS 5139 for battery installations
-
selecting equipment suitable for Sunshine Coast humidity and salt air, including IP65 rated enclosures and appropriate mounting.
If you would like to discuss solar, batteries or EV charging on the Sunshine Coast, you can call Sunshine Coast Projects & Electrical on 0400 677 514. They can assess whether a battery suits your property now, or whether other steps, such as upgrading solar or improving efficiency, should come first.
In Summary
Under 2026 style Queensland tariffs, the large gap between higher evening usage rates and lower feed-in tariffs makes self-consumption through a battery far more valuable than heavy exporting for many households. That does not mean every battery will “pay for itself”, but it does mean storage is now worth a careful look for a wide range of Sunshine Coast properties.
The worked examples in this article showed:
-
a typical family with time-of-use tariffs and a 10 kilowatt hour battery seeing mid-range payback under reasonable assumptions
-
a high-use home with an EV and a larger battery seeing stronger outcomes due to heavy cycling
-
a low-use couple on a flat tariff facing a much longer timeline, where peace of mind and outage protection may matter more than bill savings.
Those cases illustrate how tariffs, usage, battery size, efficiency, degradation, warranties and non-financial goals all pull on the result.
Any real decision should fold in current tariffs, feed-in rates, round-trip efficiency figures, warranty details, government schemes and personal factors such as outage risk and future plans. Sunshine Coast Projects & Electrical can bring those pieces together for your property, provide transparent numbers without promising specific savings, and help you weigh both the risks and the potential benefits before you invest. Ready to discuss the right electrical solution? Call Sunshine Coast Projects & Electrical on 0400 677 514 to request an obligation-free quote. Learn more at https://sunshine-coast-electrician.com.au/services/ or contact the team at https://sunshine-coast-electrician.com.au/contact/. For authoritative information, see https://cer.gov.au/.
Frequently Asked Questions
A good payback period for a solar battery on the Sunshine Coast often sits somewhere around 5 to 9 years under current style tariffs, based on many real-world examples. Some homes see shorter times with strong rebates and high night usage, while others land closer to 10 or 12 years. Anything longer than expected battery life needs extra thought. These figures are general guides only, and your actual result needs careful, site-specific modelling.
In many cases, yes. 2026 style Queensland tariffs, with lower feed-in rates and higher evening usage charges, tend to increase the value of self-consumption over exporting. That means stored solar can now offset more costly grid power than in the past. However, tariff structures and government policies still change, so households should review plans and rules every year or two using official resources such as Energy Made Easy and Queensland Government energy information.
For a typical 6.6 kilowatt system, many homes suit a usable battery size roughly between 6 and 13 kilowatt hours. The right point depends on:
Usually not. A typical home battery system in Queensland is designed to power selected essential loads in a blackout, not every circuit in the house.
Government rebates and programs can noticeably change battery payback because they lower upfront cost. For example:
Whether you add a battery to existing solar or upgrade everything at once depends on your current hardware and plans:
-
If your existing inverter is in good condition and sized well, an AC-coupled battery such as a Tesla Powerwall can often be added without replacing panels or inverters.
-
If your inverter is aging, undersized or not compliant with current standards, moving to a new hybrid inverter and integrated battery may be more sensible.
-
If you plan to expand your solar array, it may be cost-effective to design the upgraded solar and battery together.
An on-site check of your switchboard, wiring and inverter by Sunshine Coast Projects & Electrical is the safest way to decide which approach suits your property, budget and future plans.